Case studies
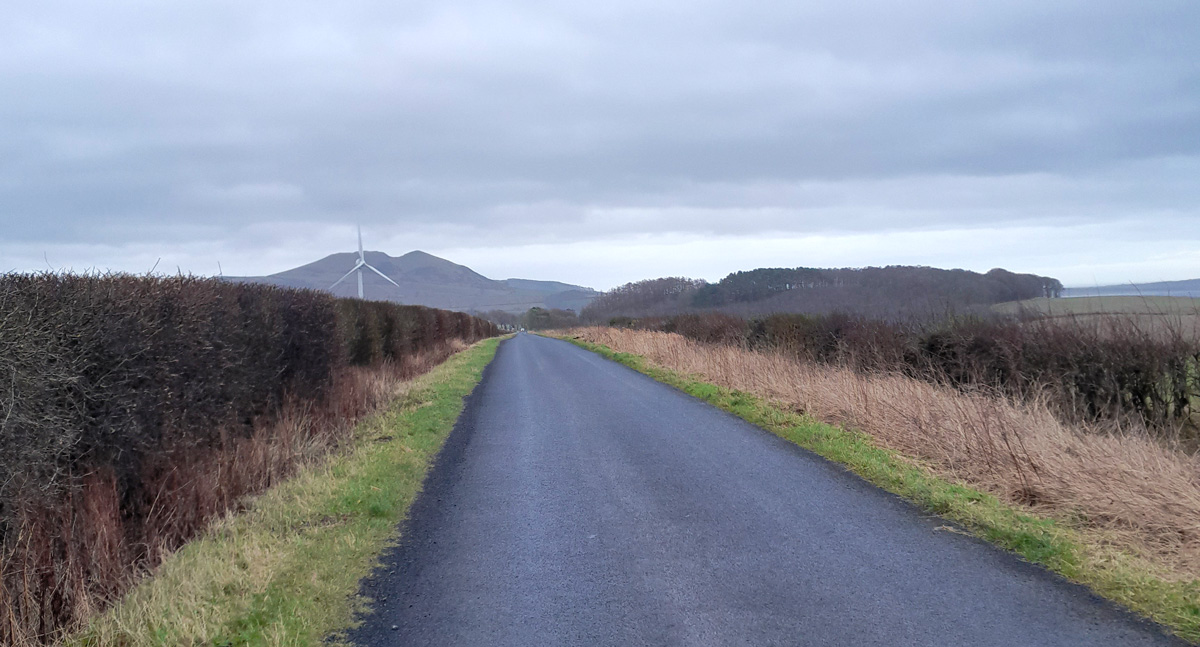
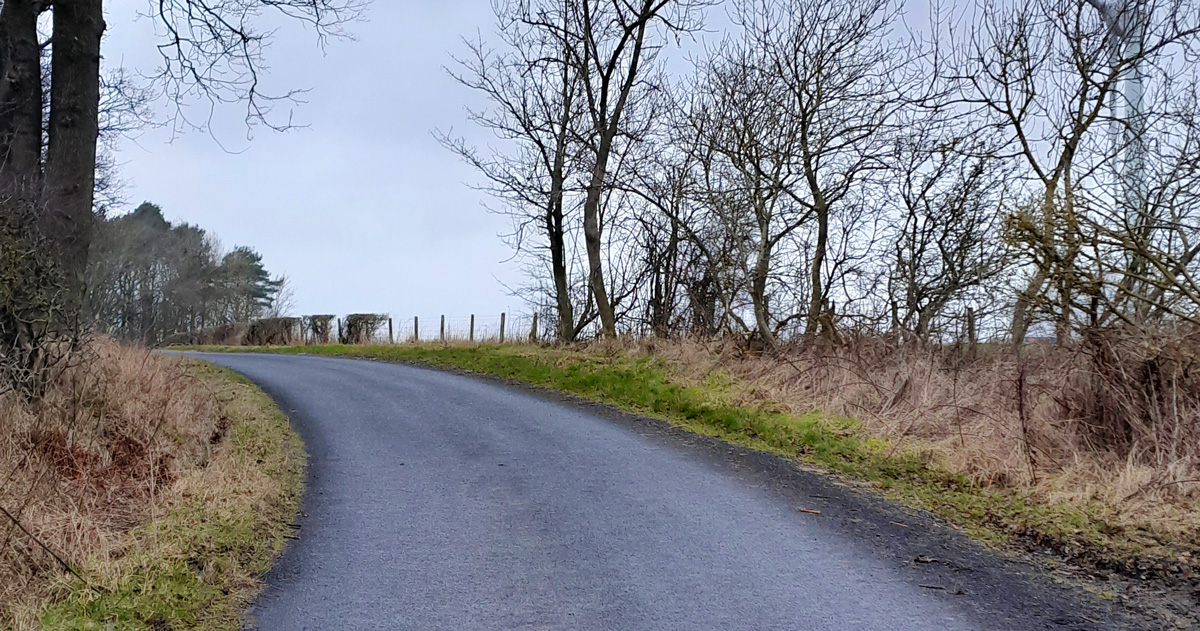
Lundin Links road surface LiDAR scanning
Roads
As leading academics undertaking research on road surface materials and characteristics we specialise in non-standard testing and consultancy.
Who:
R3 was commissioned by Stablished Pavements to conduct LiDAR scanning and analysis of the road surface pre and post treatment on the U084 Lundin Links in Fife, Scotland.
Here, Stabilised Pavements was conducting its Cold In-situ Recycling process to restore the structural integrity and ride quality of the road.
Working in accordance with the British Standard BS:9228, design guide TRL Report 611 and the RSTA’s Code of Practice, SPL undertake in-situ recycling processes for the treatment of failing carriageways.
The process involves firstly pulverisation of the existing carriageway in-situ and then second, spread and mixing in a cementitious powder to create a Hydraulically Bound Material layer to form a strengthened pavement. Throughout the operation the materials are trimmed, graded and compacted to return the recycled layer back to required finish levels before an asphalt surfacing or surface dressing is applied.
What was the challenge?
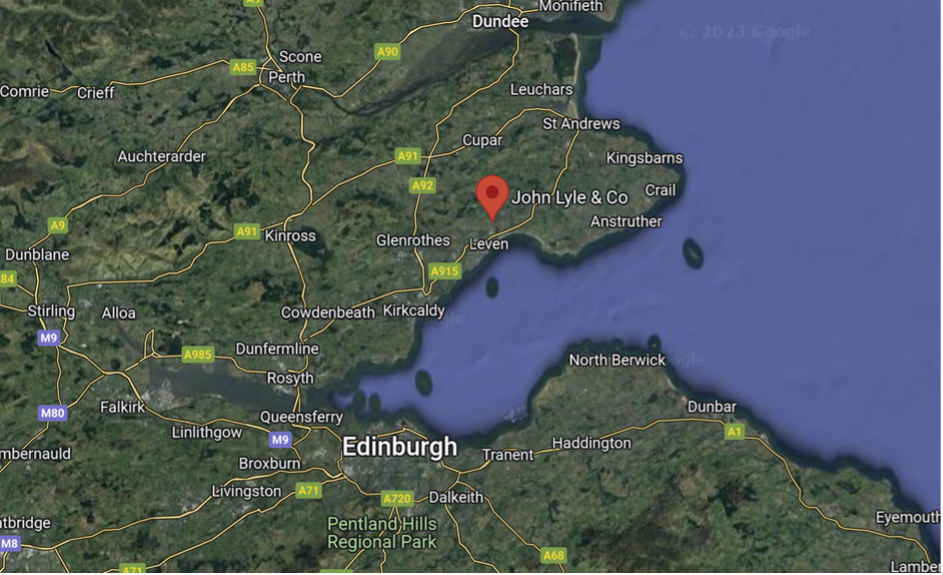
Figure 1. Trial site location
Stabilised Pavements wanted scientific and pictorial evidence to illustrate to its client the significant improvement in the ride quality and drainage characteristics by showing in detail the condition of the road both before and after works.
This evidence base could also be used to show future clients the success of the works and the process as well as inform the company engineers of the results from different work sites.
What was the solution?
R3 used LiDAR scanning and analysis of surface pre and post treatment to help demonstrate the condition of the road before and after the In-situ recycling process to help highlight the benefits of the work.
Surface Improvement Visuals
Figures 3, 4 and 5 are taken from the LiDAR scan 3D point clouds and show how the surface has been improved as a result of the treatment works. Each before-and-after set of images were taken from the same location and with the same colour intensity settings. The images show how the treatment works have improved transverse and longitudinal profiles, rectified potholing, edge break up and general surface deterioration.
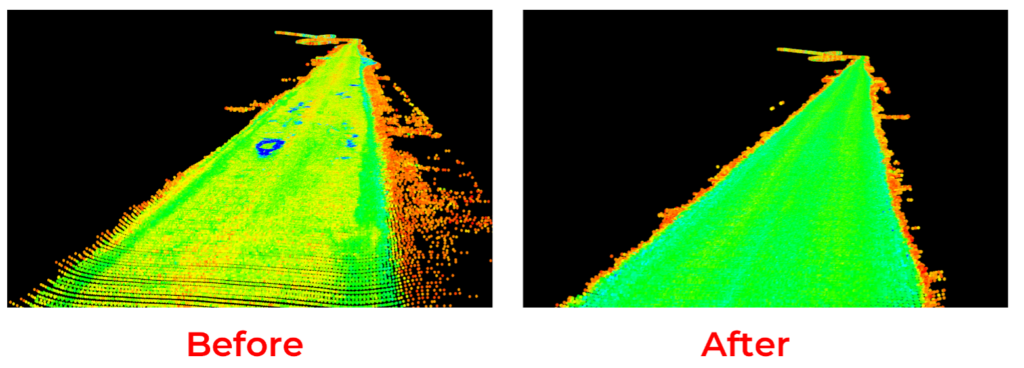
Figure 3. Improvement of profiles and potholes
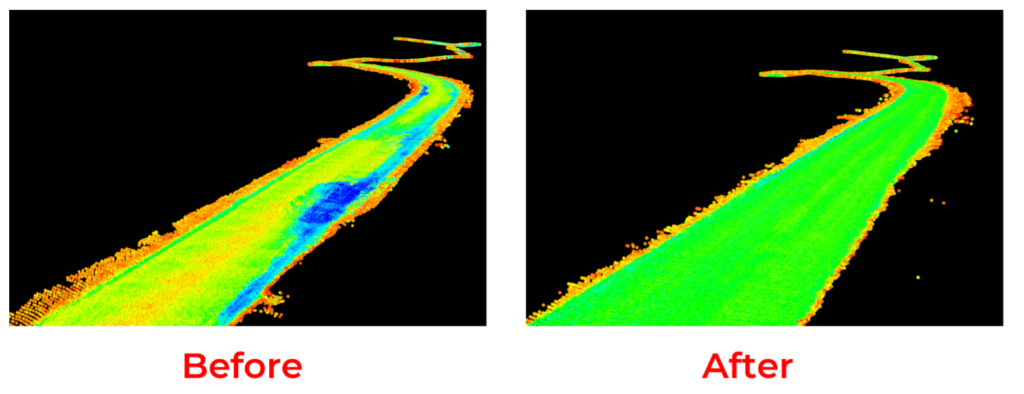
Figure 4. Improvement of edge break up
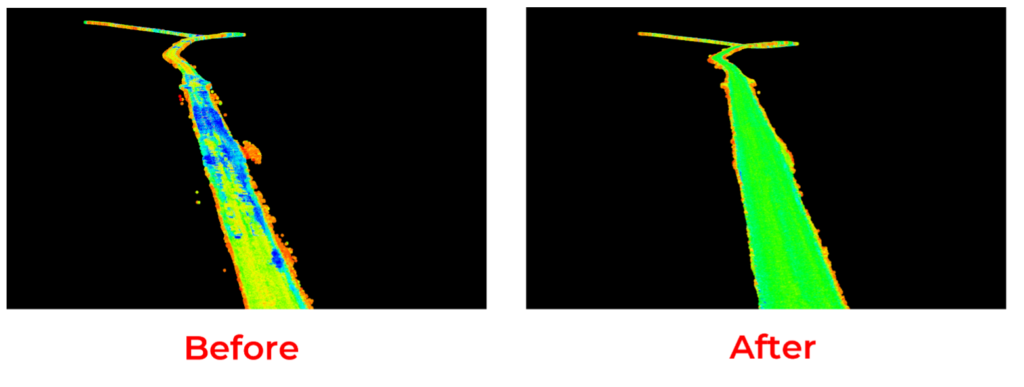
Figure 5. Improvement of surface deterioration
Contour Improvements
Figure 6 shows how the surface contours have been improved as a result of the treatment works. The before-and-after images were taken from the same location and with the same contour settings. The before image shows the majority of the section to have bumps, depressions and potholes which trap water on the pavement. The after image shows the majority of the section to have a smoother profile which will aid the dissipation of water from the pavement surface.
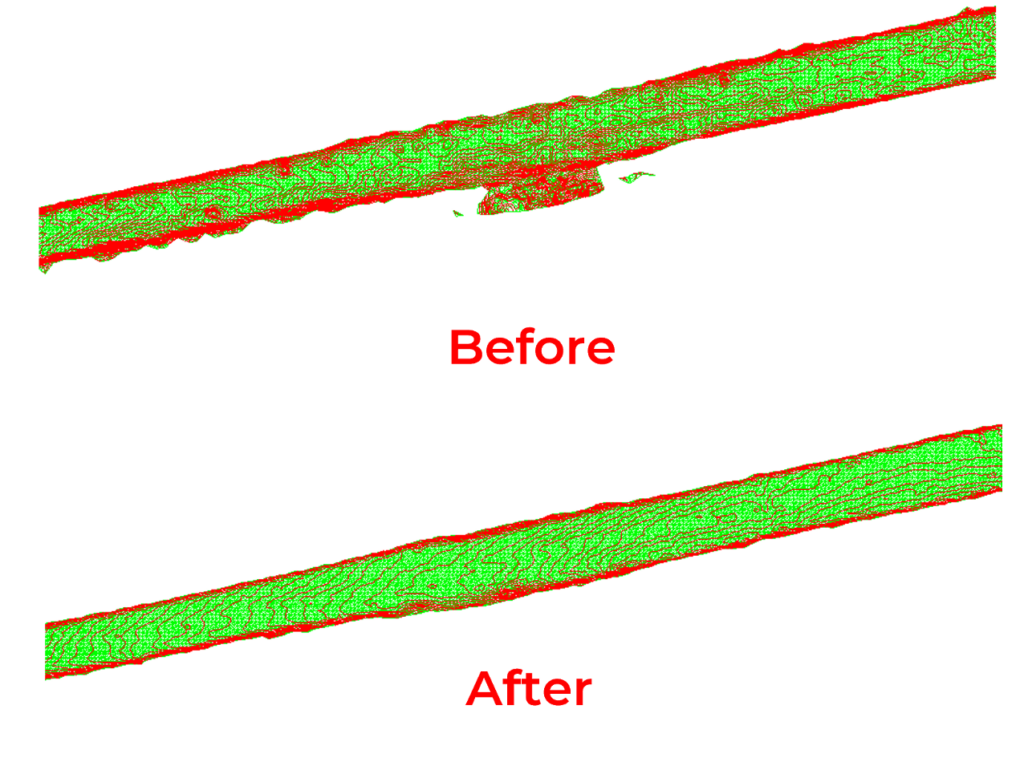
Figure 6. Improvement of contours
Cross Slope Improvements
Figures 7 and 8 show how the surface cross slopes have been improved as a result of the treatment works. Each before-and-after set of images were taken from the same location. Figure 7 shows how the cross slope has been improved from -8.19% to -1.27% as a result of the treatment works. Figure 8 shows how the cross slope has been improved from -5.76% to -1.14%. To put this in context, a typical carriageway would have maximum cross slopes of 2.5%.
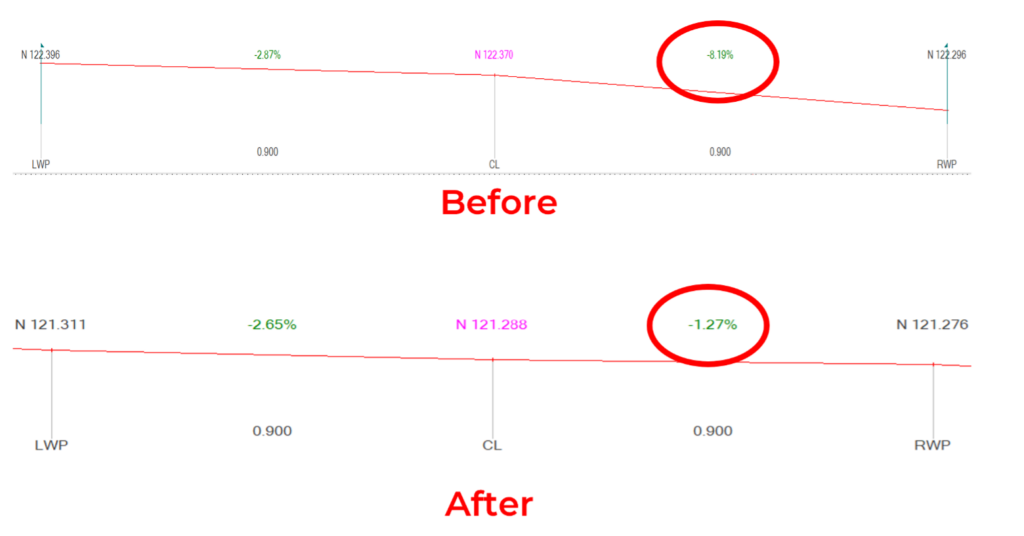
Figure 7. Cross slope improvements (1)
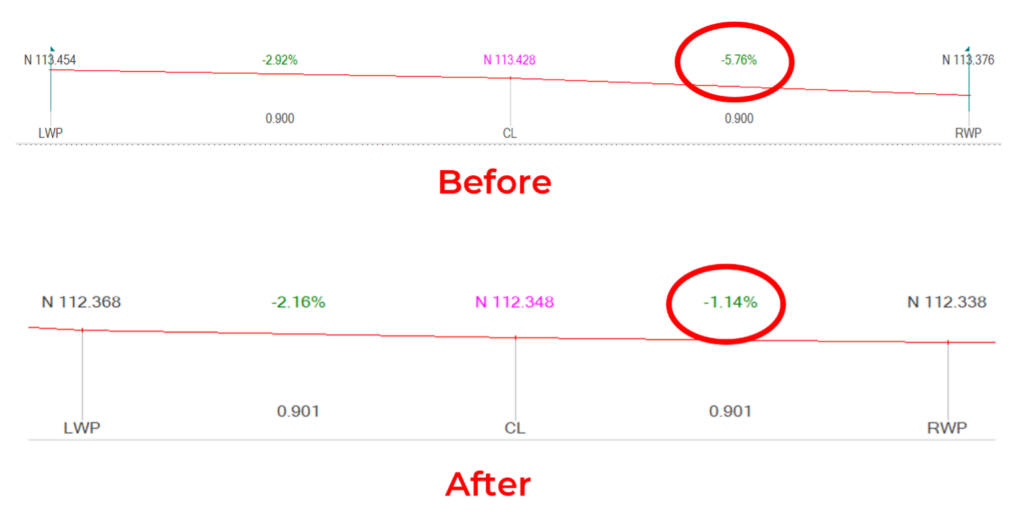
Figure 8. Cross slope improvements (2)
Ride Quality Improvements
The international roughness index (IRI) is used to define a characteristic of the longitudinal profile of a travelled wheel path and constitutes a standardised measurement of ride quality. The commonly recommended units are meters per kilometer (m/km). Table 1 shows how the overall IRI has been improved by 43% in the left wheel path and by 37% in the right wheel path as a result of the treatment works. Figures 9 and 10 show graphically how the IRI has been improved for the left wheel path and right wheel path at 25m segments respectively.
Table 1. IRI improvements for each wheel path
|
Wheel Path |
Works |
IRI (m/km) |
% Improvement |
|
Left |
Pre-Treatment |
4.276 |
43% |
|
Left |
Post-Treatment |
2.450 |
|
|
|
|||
|
Right |
Pre-Treatment |
3.881 |
37% |
|
Right |
Post-Treatment |
2.431 |
|
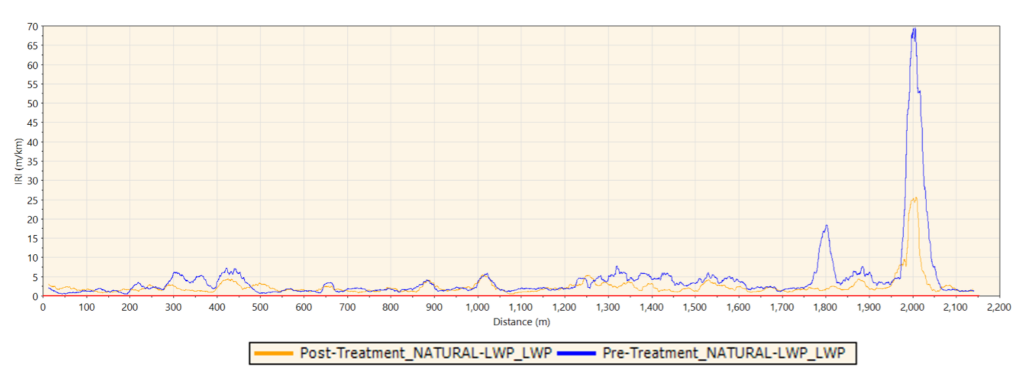
Figure 9. IRI pre and post treatment for the left wheel path
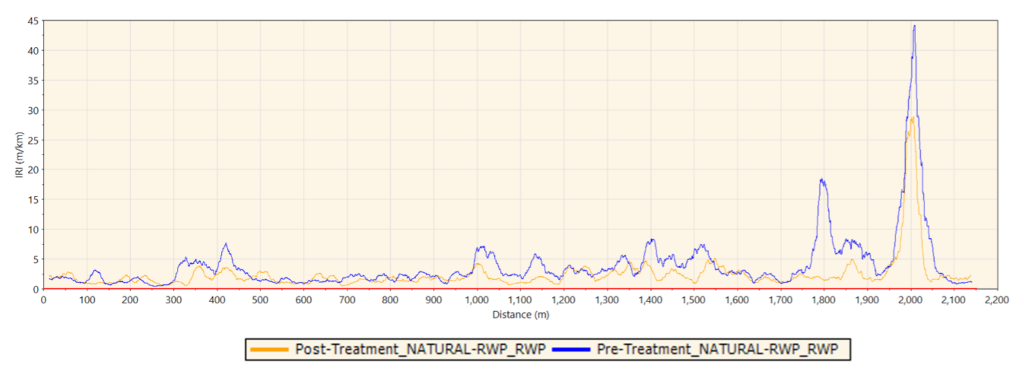
Figure 10. IRI pre and post treatment for the right wheel path
R3 offer a unique consultancy and testing service for the highway industry in the UK, Ireland and the World. Utilising a specialist Highway Laboratory, with over thirty years of experience in the road’s industry, R3 can offer non-standard solutions to problem areas of highways and material approval. Our core value of taking a research-based approach to difficult highway material problems allows us to offer unique solutions to problems. With the ability to advise, create and test solutions R3 Ltd can work with road operators, asphalt providers and highway authorities to develop materials and unique solutions.
What the client said:
“We are always looking how we can add value to our contracts for our customers. Having detailed scientific and pictorial evidence to show to our client how the condition of their road had improved after works are complete was very valuable. In the case of the works in Fife, we were able to demonstrate that the road had improved both in terms of shape and smoothness as well as the overall condition improving and therefore protecting and preserving the road in its improved state for longer.
We were impressed with the team at R3 and their approach to this project as well as their use of LIDAR scanning and the level of detail it produced. We will now be considering how to incorporate this service and technology in future projects.”